Regular Email Reporting
You can receive regular email summaries of each online advertising order. We send these emails every Monday evening. You can elect for the following frequency:
- Weekly: Every Monday (the date range of data is the previous 30 days)
- Monthly: 3rd day of every month (the date range of data is the previous month)
- Twice Monthly: The second and fourth Mondays of the month (the date range of data is the previous 30 days).
Official Schedule
- Dates 1–7: Week 1 = weekly, monthly
- Dates 8–14: Week 2 = weekly, twice monthly
- Dates 15–21: Week 3 = weekly
- Dates 22–31: Week 4 = weekly, twice monthly
How to Sign up for regular email summaries:
- - Ask your Digital Throttle sales rep to setup your schedule
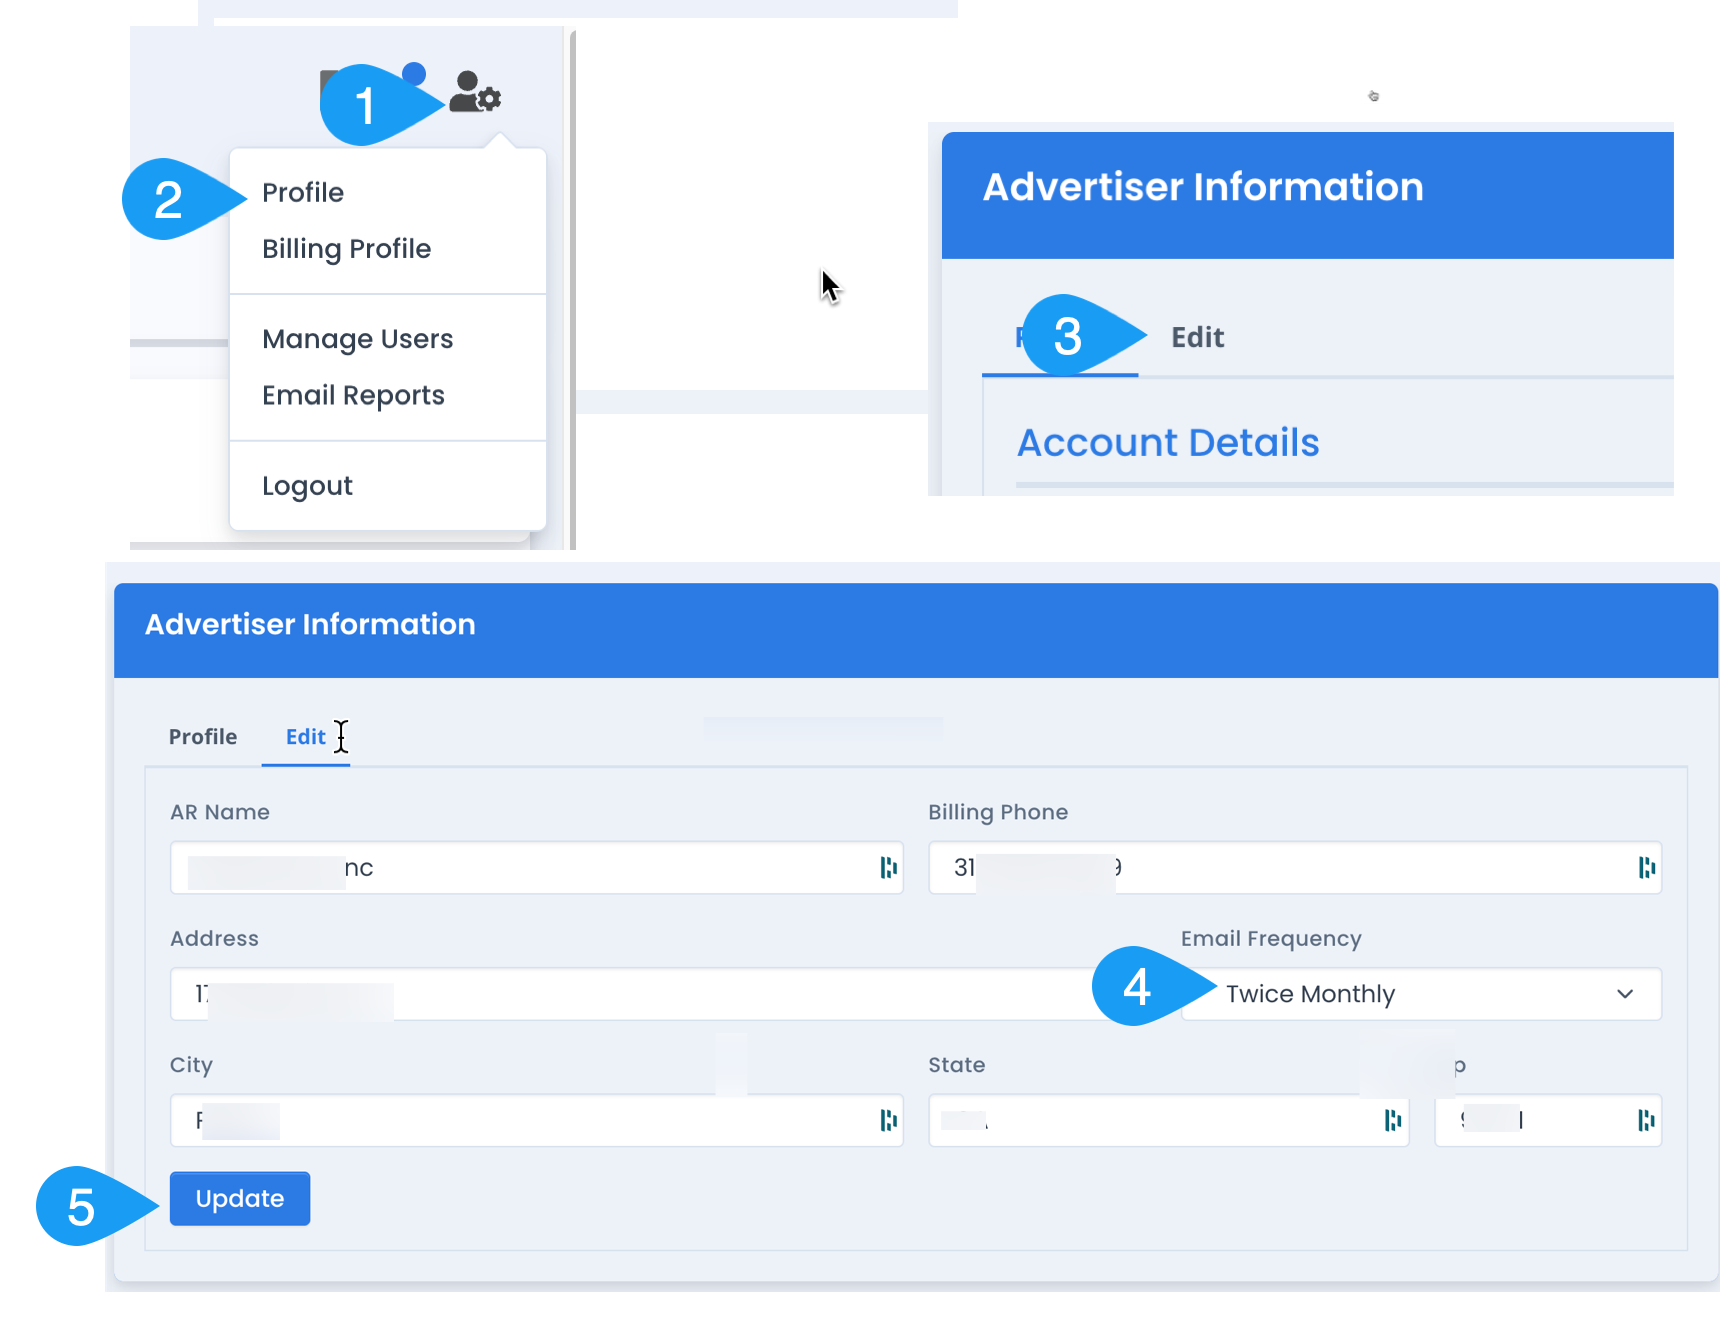
- - In https://reporter.digitalthrottle.com, you can set your email frequency:
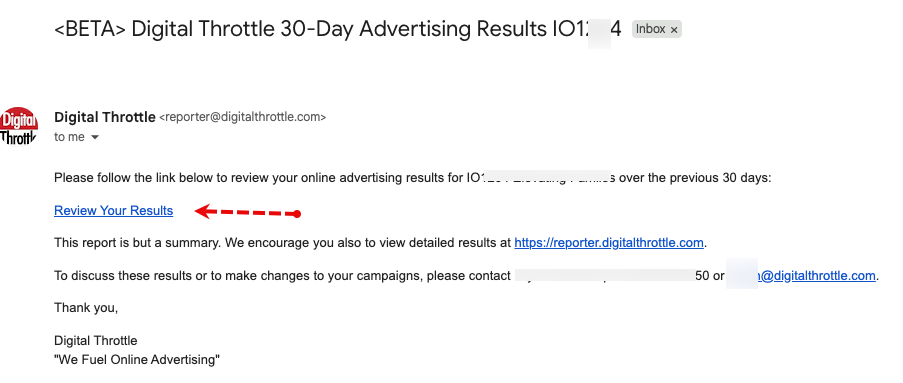
Example of Email
Email will be sent from reporter@digitalthrottle.com
Example of Linked Report in the Email
See the corresponding numbers for explanations of each section.
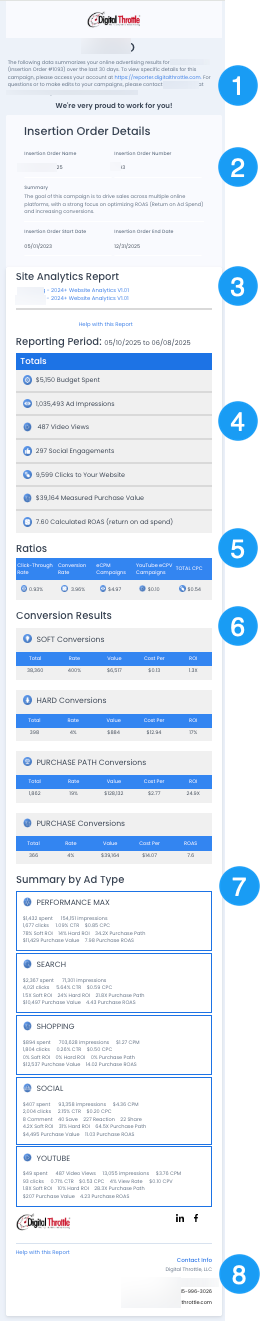
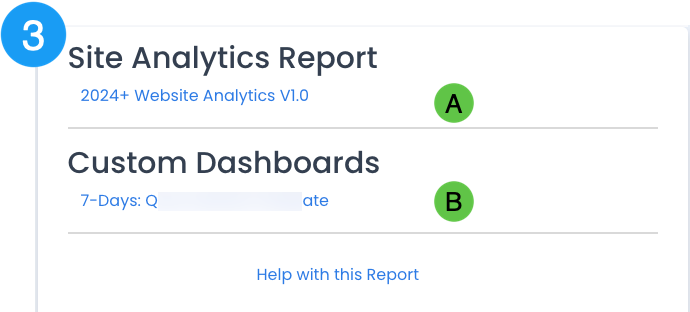
SECTION 1 & 2 Details
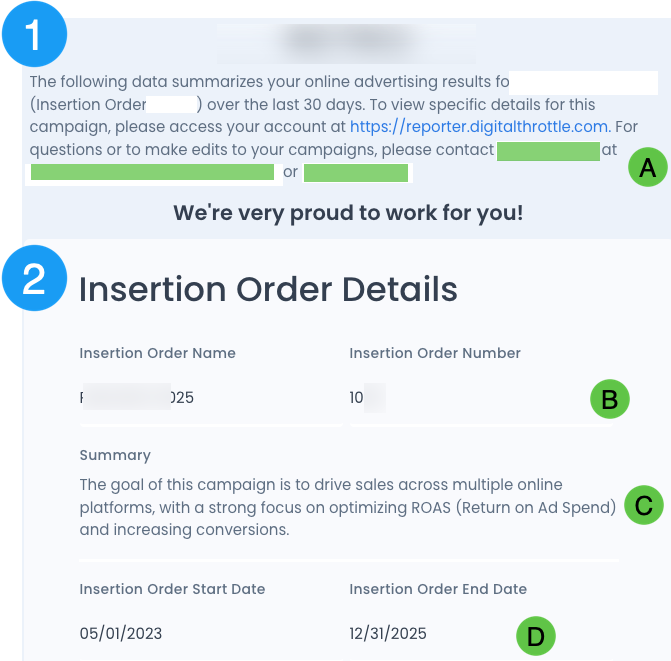
- (A) Your Digital Throttle Sales Contact is listed here. They are also cc'd on the report.
- (B) The name of your online advertising order and its assigned insertion order (aka "IO") are listed here.
- (C) We may show a short summary of your online advertising order goals and details.
- (D) We show the first and last date your online ads are scheduled to run here.
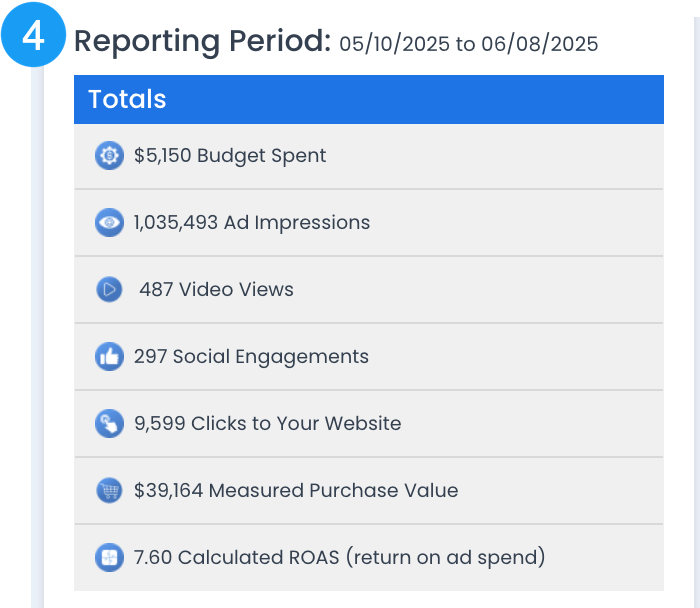
SECTION 3 Details
- (A) This links to your total site traffic results. See HERE for details on this report.
- (B) You may also have a custom report that is a pre-built filter. You will need to be logged into reporter.digitalthrottle.com to view this custom dashboard.
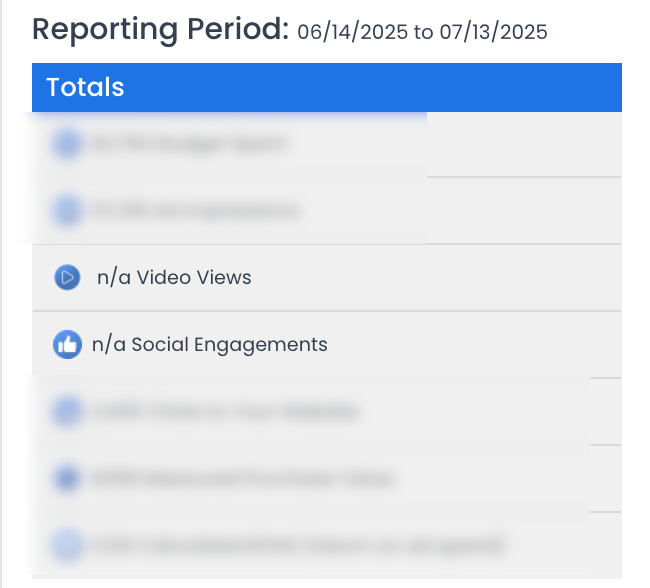
SECTION 4 Details
Using the numbers shown above, here is how to interpret the results for the reporting period shown (in this case 5/10/25 to 6/8/25):
- Amount Spent for the reporting period was $5,150 (we round)
- The total number of times all ads were seen (impressions) was 1,035,493
- The video ads (on YouTube or streaming) were viewed 487 times. In the case of YouTube, we count views only from persons that do not click the "skip" button — typically watch at least 7 seconds of the video.
- The social ads also received 297 engagements such as sharing, saving, liking & commenting on the social post.
- The advertiser received 9,599 website visits from clicks on all their ads.
- For clients selling on their websites, Digital Throttle ads generated $39,164 in e-commerce orders we can definitely measure.
- Considering just the e-commerce revenue, the ROI from the paid advertising is 7.60. The common term is a 7.60 ROAS — "return on ad spend" — calculated by dividing the Measured Purchase Value by Budget Spent [$39,164 / $5,150] = 7.60.
NOTE: if you see a "n/a" like shown below, that means you are not using that type of ad. If we're not tracking e-commerce sales, you will also see a "n/a" listed.
SECTION 5 Details
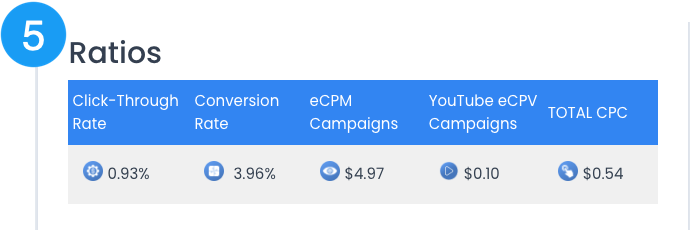
Common practice is to use ratios to compare different forms of online advertising. Using this report, here are the calculations:
- Click-Through Rate (CTR): 9,599 clicks ÷ 1,035,493 impressions = 0.93%
- Conversion Rate: 40,986 conversions ÷ 1,035,493 impressions = 4%
- eCPM: $5,150 ÷ 1,035,493 ÷ 1,000 = $4.97
- YouTube eCPV: $49 ÷ 487 views = $0.10
- Total CPC: $5,150 ÷ 9,599 clicks = $0.54
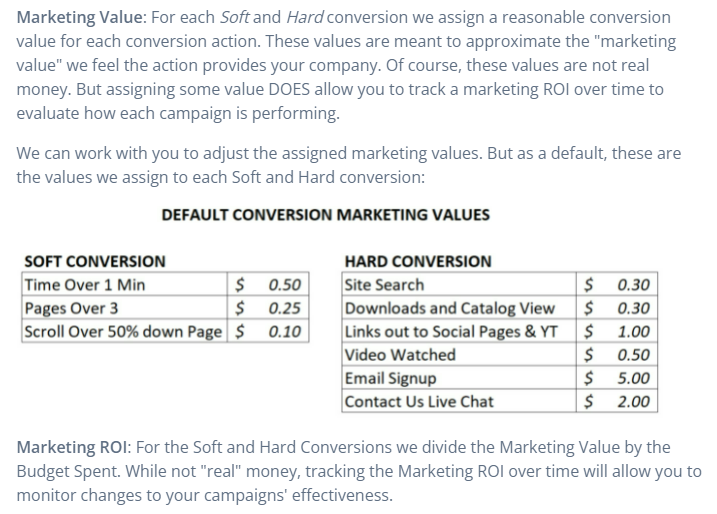
SECTION 6 Details
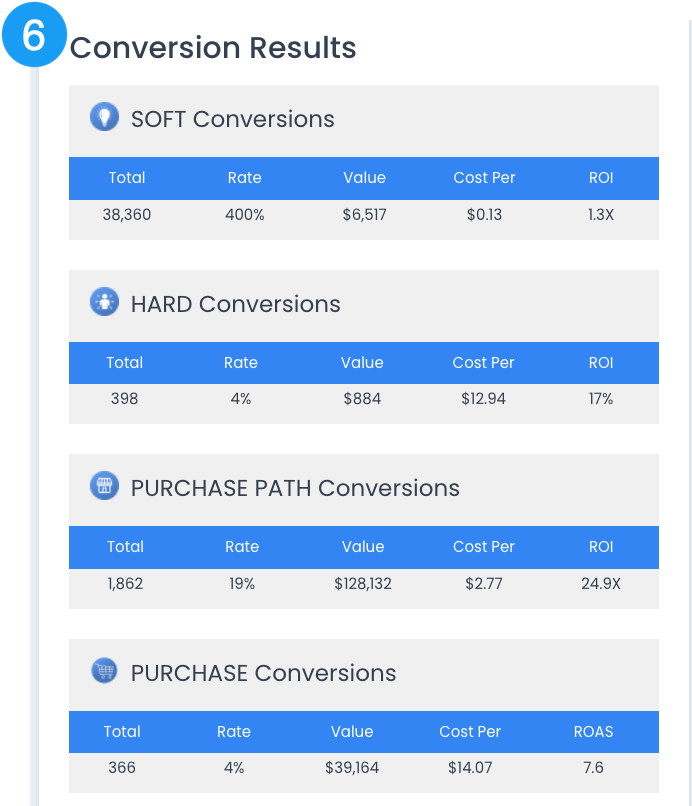
Soft Conversions measure "Engagement" on your website for people clicking on your digital ads.
Hard Conversions measure key click actions on your site such as watching a video, downloading a catalog, signing up for a newsletter, or sending you an email.
Purchase Path conversions count any activity on your site indicating "purchase intent" — Add to Cart, Initiate Checkout, Find a Dealer, etc.
Purchase Conversions count how many e-commerce orders the paid ads generated. ROAS is the order value divided by Budget Spent.
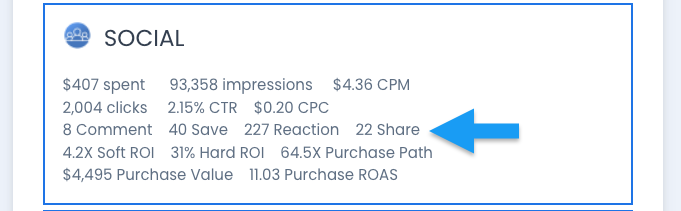
SECTION 7 Details
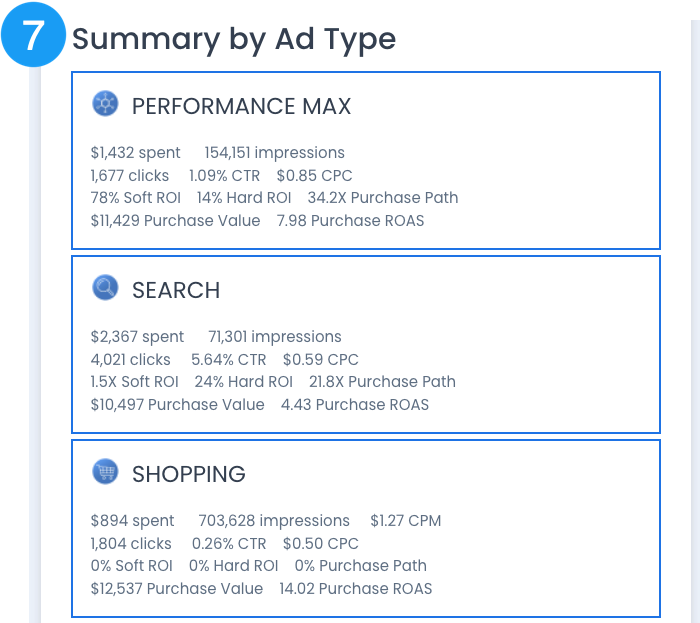
This section details the metrics reviewed above, but segmented by each type of online ad.
SECTION 8 Details
We repeat the contact information for your sales representative.